Chart.js(vue-chartjs) でツールチップの表示内容を変更
はじめに
Chart.js (vue-chartjs) でツールチップの表示内容を変更する方法
TL;DR
- テキストは
tooltips.callbacks.xxxxで設定tooltips.callbacks.titletooltips.callbacks.labeltooltips.callbacks.footer
- 色などを変更する場合は以下、他は Tooltip Configuration を参照
tooltips.backgroundColortooltips.titleFontColortooltips.bodyFontColortooltips.footerFontColortooltips.titleFontStyle- etc…
目次
環境・条件
1 | $ sw_vers |
詳細
参考: Tooltip · Chart.js documentation
設定方法
表示テキストを変更する場合は以下を設定
1 | options: { |
TooltipItem の構造は Tooltip Item Interface に記載されている。
1 | { |
実際の値は以下のような感じ。
1 | // tooltips.callbacks.label での一例 |
data は以下のようなデータになっている。(チャート形式、対象コールバックなどで異なるかも)
1 | data: { |
表示色などを変更する場合は以下を設定
tooltips.backgroundColortooltips.titleFontColortooltips.bodyFontColortooltips.footerFontColortooltips.titleFontStyle- etc…
※その他は Tooltip Configuration を参照
vur-chartjs サンプル
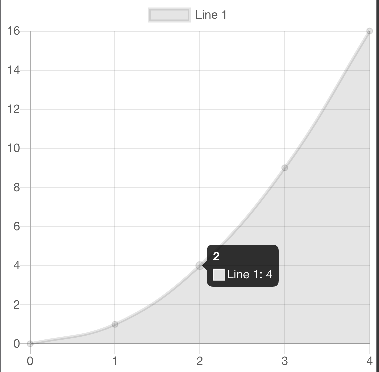
デフォルト
まずは何も設定しない場合
MyLineChart.js
1 | import { Line, mixins } from 'vue-chartjs'; |
MyLineChart.vue
1 | <template> |
表示されるツールチップは以下
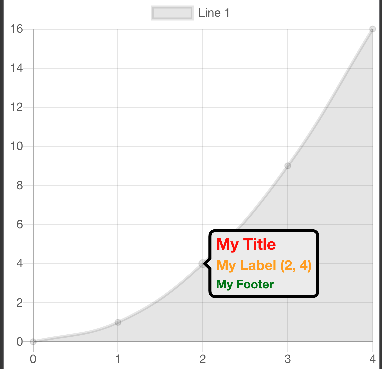
カスタム
options.tooltips を設定した場合。ざっくり解説は以下。
callbacks.title,callbacks.label,callbacks.footerでテキストを編集backgroundColorでツールチップ内の背景色を指定borderColor,borderWidthでツールチップの縁取り指定displayColorsでツールチップ内の色凡例を非表示titleFontColor,bodyFontColor,footerFontColorでテキスト色を指定titleFontStyle,bodyFontStyle,footerFontStyleでテキストのスタイルを指定titleFontStyle,footerFontStyleはデフォルトboldなので省略可
titleFontSize,bodyFontSize,footerFontSizeでテキストサイズを指定
1 | <template> |
表示されるツールチップは以下
まとめ
- テキストは
tooltips.callbacks.xxxxで設定tooltips.callbacks.titletooltips.callbacks.labeltooltips.callbacks.footer
- 色などを変更する場合は以下、他は Tooltip Configuration を参照
tooltips.backgroundColortooltips.titleFontColortooltips.bodyFontColortooltips.footerFontColortooltips.titleFontStyle- etc…
その他・メモ
表示位置を変える例は以下。
参考文献
関連記事
- apertureless/vue-chartjs でチャートの高さ(や幅、サイズ)を変更
- Chart.js で X軸, Y軸の値をカスタマイズ
- Chart.js(vue-chartjs) で凡例の一部を非表示にする方法
- Chart.js(vue-chartjs) でツールチップの表示位置を変更
- Vue でローソク足(OHLC)チャートをプロット
- Vue.js で日本語変換での誤発火を抑止しつつ Enter キーで Submit
- JavaScript で URL のクエリパラメータを操作する方法
- jQuery Select2 で、初期値の設定と選択状態のクリア